Digital Humanities 101: Intro to Digital Humanities
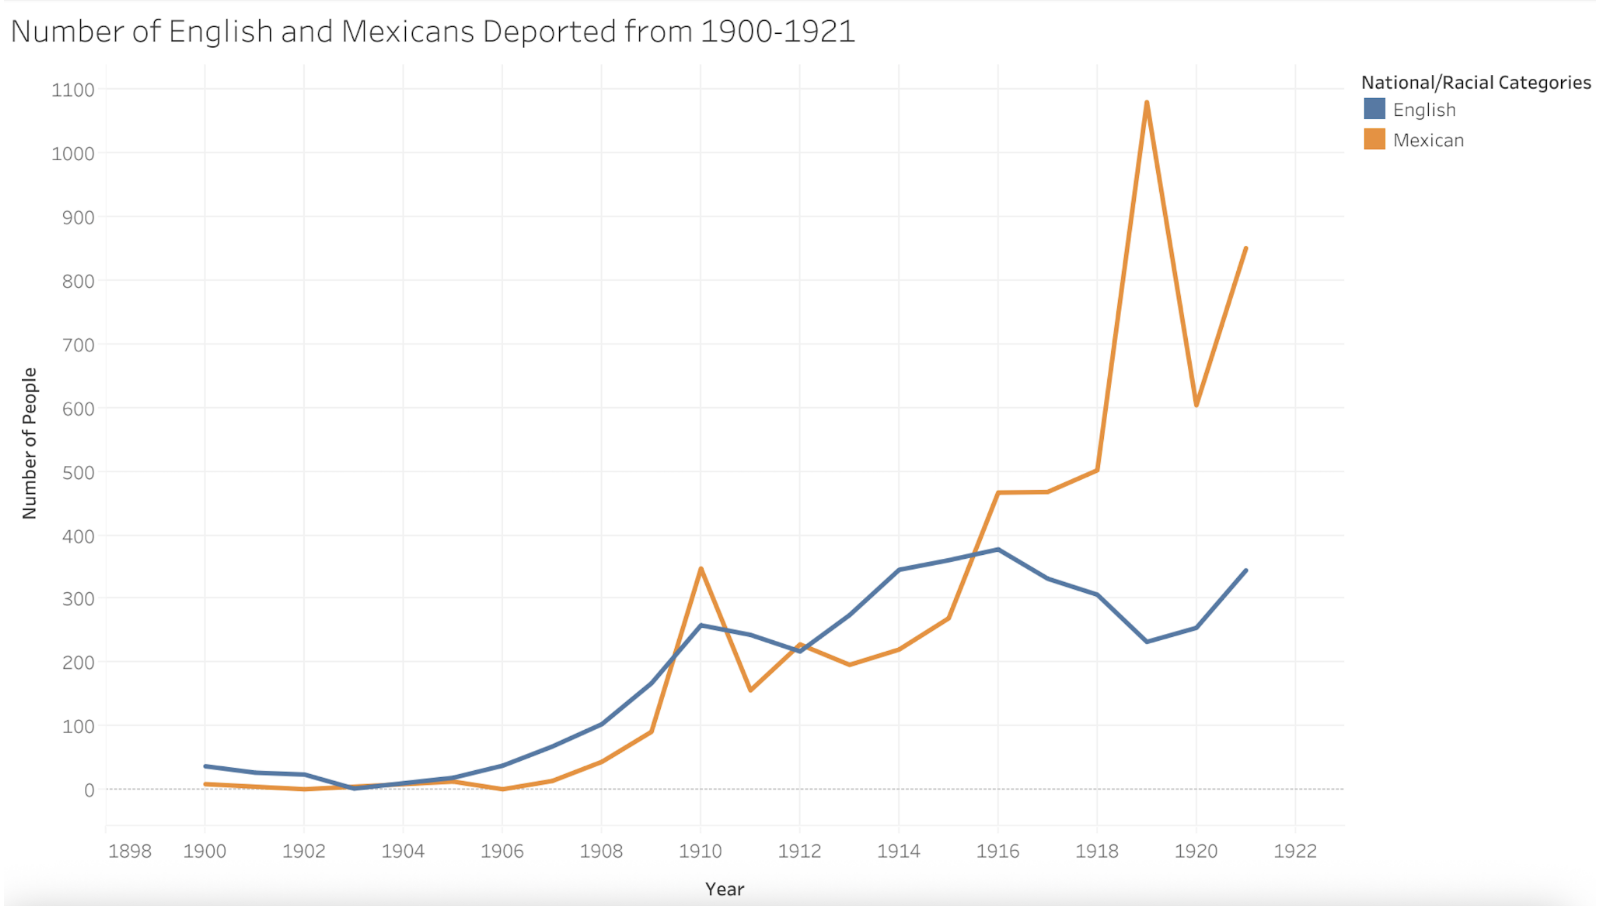
Tableau visualization of trends in English and Mexican deportations from 1900-1921 as included in students’ report published via GitHub.
Students cleaned, analyzed, and visualized over 40,000 historical deportation records from a Harvard Dataverse dataset to examine how U.S. deportation policies between 1892 and 1921 affected English and Mexican immigrant communities differently, and what the data’s gaps reveal about the power structures behind its creation.
Project Contributors: Dylan Brunkhardt, Kenneth Tran, Yuexi Liao, Yitian Hu, Yahir Perez, Rohan Akurathi